
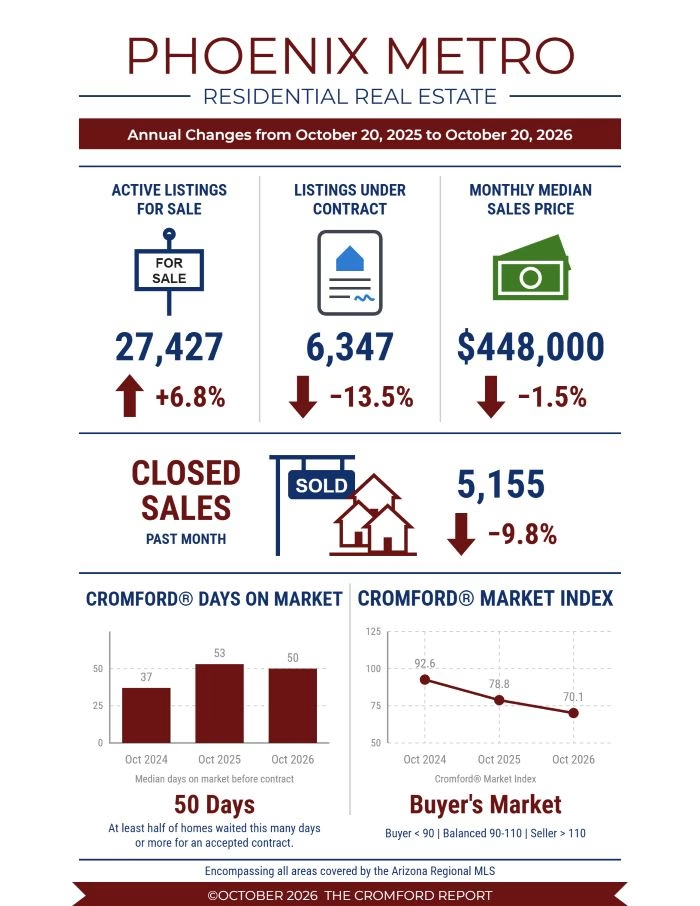
Supply of Homes Under $400,000 Up 25% Since September Closings Down 9.8% Over the Past Month
For Buyers
In times of uncertainty, it’s good advice to focus more on what is known than unknown. Mortgage rate predictions have missed their marks repeatedly over the past 4 years, causing them to be a poor data point on which to base home buying decisions. The only rate that is known is the one quoted today, which is averaging 7.4% as of October 21st. A general rule of thumb to use with fluctuating rates is with each 0.1% fluctuation in the rate, add or subtract 1% on the principal and interest payment. Therefore, a payment quote of $2,500 for a loan around $360,000 at 7.4% will go down by roughly $25 at 7.3%. Buyers who purchase their home today at 7.4% do not need to stress under the uncertainty of where rates are going. If rates go up, they are set. If rates eventually go down to 6.0% again, they don’t miss out. They contact their lender, refinance the loan, and drop their payment.
It’s not all about the mortgage rate, however. When prices decline, buyers either get a little more home for their budget, or they get a lower payment for the same home. For example, if the mortgage rate goes up by 0.5%, the payment goes up 5%. However, if the price comes down 5% for the same home, the payment goes down 5%.
There have been 17,077 single family homes under $400,000 listed for sale in Greater Phoenix so far this year, 14.4% higher than the same time frame in 2023, and active counts have accumulated 25% since the beginning of September. Buyers get a median of 1,548 square feet for a $400,000 budget, which is 100sqft more than 2022, and single family homes make up 55% of all sales in this range.
Here is a breakdown of where prices are dropping and where they are not:
| Price Range | 2025 Oct 1-18 Avg $/SF | 2026 Oct 1-18 Avg $/SF | % Difference |
| Under $300,000 | $184.69 | $174.08 | -5.7% |
| $300,000 to $399,999 | $226.74 | $215.69 | -4.9% |
| $400,000 to $499,999 | $237.39 | $232.62 | -2.0% |
| $500,000 to $599,999 | $253.96 | $250.44 | -1.4% |
| $600,000 to $799,999 | $274.77 | $283.46 | +3.2% |
| $800,000 to $999,999 | $311.83 | $308.87 | -0.9% |
| $1,000,000 to $1,499,999 | $363.49 | $384.10 | +5.7% |
| $1,500,000 to $1,999,999 | $463.89 | $484.63 | +4.5% |
| $2,000,000 to $2,999,999 | $575.44 | $624.20 | +8.5% |
| $3,000,000 and over | $756.40 | $957.16 | +26.5% |
| All price ranges | $292.10 | $311.12 | +6.5% |
For Sellers
Prices are holding up even as demand softens. The median sales price over the past month was $450,000, unchanged from the same period last year. Sellers should still be prepared for a longer wait. The median home that went under contract in that period was on the market for 50 days compared with 53 days a year ago, and 38 days two years ago.
Fewer homes are selling. Closings fell 9.8% to 5,155 over the past month compared with last year. September closings were 4.7% below September 2025, the second month in a row below last year after every month from January through July came in higher. New listings were down too, 9,287 over the past month against 9,618 a year earlier (-3.4%). Supply is building because fewer listings are selling, not because more are coming to market.
The luxury market is the exception. September closings over $1.5 million rose 25% from last year, 264 against 211, and 62 homes sold over $3 million compared with 57 last September. With contracts at their lowest mid-October level since at least 2011 and rates above 7%, closings are likely to stay below last year through the rest of the fall.
Sellers who price to where buyers are writing contracts today will be the ones who close before the holidays.
Commentary written by Tina Tamboer, Senior Housing Analyst with The Cromford Report @2026 Cromford Associates LLC and Tamboer Consulting LLC

