
A Seller’s Choice: Price or Patience?
The Affordability Equation is Not Great, But Improving
For Buyers
The topic of affordability continues to be a popular post on social media and journalistic headlines. This month, the Consumer Price Index (CPI) showed a 0.3% increase in its shelter index, which accounted for 30% of the overall monthly inflation measure. This was not a good indicator for conventional mortgage rates, which responded by increasing the 30-year rate to 7.5%. But the CPI only measures the cost to rent, not the cost to purchase. What the CPI uses instead is the “Owners’ Equivalent Rent”, which accounts for nearly 74% of the shelter index and is derived from a survey that asks existing homeowners to estimate what their home would rent for if it were available. This is not the same as the affordability rate of homes for sale.
When it comes to homes for sale, various measures broadly use the U.S. Median Household Income against the U.S. Median Sales Price of a home. Seems reasonable at first, until one realizes household income can include single college students, or a single retiree on fixed income, and various degrees of families. Young and single first-time home buyers obviously don’t typically make the median household income and they don’t typically buy a median priced home at the onset. Those that do are considered accomplished and admired. Housing affordability should ideally use the U.S. Median Family Income since most people look to purchase a home as they form family units, but even that comes with flaws as fewer couples get married before their 30s these days, and to be considered a family a household needs two or more residents related by blood, adoption, or marriage. Considering that purchasing a home is historically a team sport, a good measure for housing affordability is the 2-income family, measured and compared locally.
For this reason, the Cromford Report has developed an affordability index that looks at the measure from multiple angles. First let’s define “affordable”. The rule of thumb is the estimated mortgage payment including taxes, insurance, and PMI should land between 28- 33% of a borrower’s gross monthly income. Second, the index will estimate a 10% down payment which encompasses roughly half of borrowers, and a credit score in the low 700’s. It’s worth noting that 37-39% of borrowers in 2026 put under 5% down, and 36-38% of borrowers put more than 20% down. The higher the down payment, the more home a borrower can afford. Third, the U.S. Census ACS report released last month is only for 2025 income, so 2026 income is projected using a combination of reported Phoenix wage growth and extrapolating the existing 3-year ACS trend from 2022-2025.
With those caveats in place, let’s start with the lowest measure of affordability measured in October 2023, when a 2-income family making the projected median of $123,582 per year could only afford 30.5% of what sold in Greater Phoenix based on 28% of their gross income. The 2026 projected median income for a 2-income family in Greater Phoenix is $139,809. That family can afford 47.7% of what sold last October based on 28% of their gross income, but 60.9% of what sold based on 33% of gross income if they have low debt. To get back to pre-Covid affordability, both percentages need to improve another 30 percentage points.
For Sellers
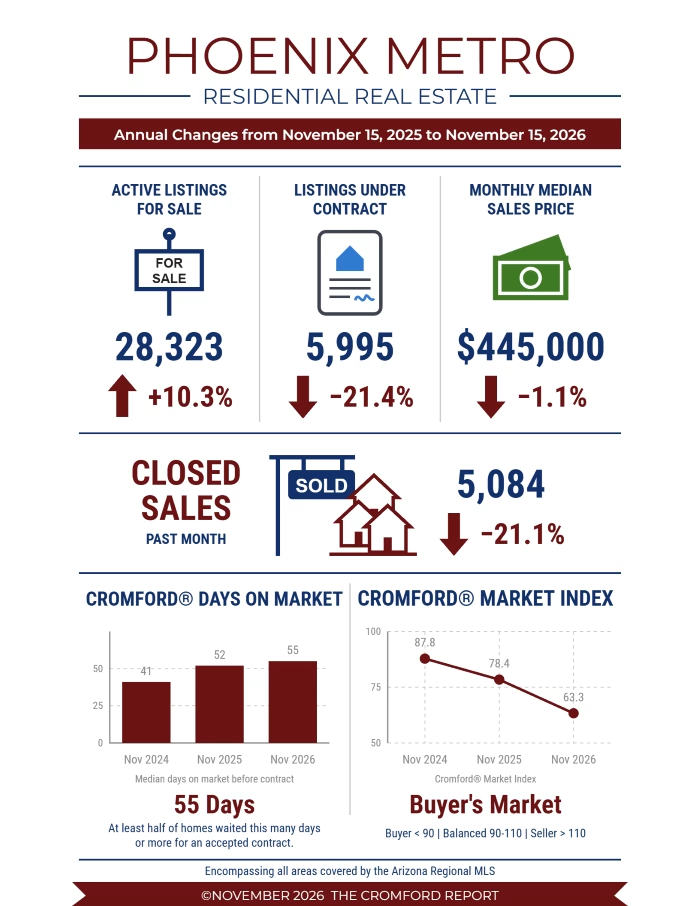
Mortgage rates have once again turned off the water when it comes to demand. After hitting a high of 7.6% in October, rates dropped to 7.2% by early November, but by November 13th they were back up to 7.5%. Volatility such as this leaves sellers with a choice to make between patience or price. Do they wait for mortgage rates to come back down while accumulating days on market, or drastically adjust their price in hopes of a faster sale?
Buyer demand has repeatedly declined over the past 4 years every time rates push past 7%. At this stage, the Cromford Demand Index has been dropping since May, which is when rates moved above 6.5%. As a rule of thumb, a 1% increase in the rate is roughly a 10% increase in the principal and interest payment for the buyer. For the payment to come back down, the buyer needs to drop their loan amount by 10%, meaning a budget of $500,000 for a loan is now $450,000. This leaves buyers with choices, too. Do they wait for rates to come back down to get a home that fits most of their needs, do they adjust their expectations and choose a smaller home to purchase today, or do they make an offer that shoots for 10% less on the home they want? The latter choice is typically rejected by most sellers.
Judging from the Cromford Demand Index at 71.4 on November 15th, 28.6% below normal, most buyers are choosing to wait. Judging from the lowest count of new single family listings added in the first 14 days of November going back to 2001, sellers are choosing to wait, too. This means that the rise in supply is not due to excessive new listings, it’s from accumulation; an important distinction as content online continuously attempts to compare this market to the 2006-2008 price bubble and crash. New single family listings added to the MLS from those years were the highest ever recorded before or since in Maricopa and Pinal County. Conversely, new single family listings frorn 2023-2026 have been the lowest ever recorded.
One thing has been consistent throughout 2026. Regardless of how much time a property has been on the market, and how many price reductions it’s had, it is typically only active for approximately 2 weeks at the last list price before accepting an offer. Negotiations are within 1% of the original list price on average if an offer is presented within the first 2 weeks. The longer a property remains on the market, the farther away it sells from its original list price, however it will still sell within 2% of the last list price within 2 weeks on average once it enters an attractive price range for buyers.
Commentary written by Tina Tamboer, Senior Housing Analyst with The Cromford Report 2026 Cromford Associates LLC and Tamboer Consulting LLC

